What is Requirements Determination?
A requirement is a vital feature of a new system which may include processing or capturing of data, controlling the activities of business, producing information and supporting the management.
Requirements determination involves studying the existing system and gathering details to find out what are the requirements, how it works, and where improvements should be made.
Major Activities in requirement Determination
Requirements Anticipation
It predicts the characteristics of system based on previous experience which include certain problems or features and requirements for a new system.
It can lead to analysis of areas that would otherwise go unnoticed by inexperienced analyst. But if shortcuts are taken and bias is introduced in conducting the investigation, then requirement Anticipation can be half-baked.
Requirements Investigation
It is studying the current system and documenting its features for further analysis.
It is at the heart of system analysis where analyst documenting and describing system features using fact-finding techniques, prototyping, and computer assisted tools.
Requirements Specifications
It includes the analysis of data which determine the requirement specification, description of features for new system, and specifying what information requirements will be provided.
It includes analysis of factual data, identification of essential requirements, and selection of Requirement-fulfillment strategies.
PROBLEM DEFINITION
- Introduction
- In most cases, the design, purchase and implementation of a GIS( Geological Information System) is a significant commitment in terms of personnel time and money
- it is extremely important to understand the issues involved in the development of GISs
- these issues will ultimately affect the efficiency and value of the installed GIS
- it is possible to identify several stages in the development of a GIS
- these can be characterized in several ways
- the following general outline serves as an organizing framework for the next 6 units:
- development progresses through the following stages
- note that these are not necessarily sequential and some may operate concurrently with others
- Problem recognition and technological awareness
- a necessary beginning point
- Developing management support
- critical to the initiation and success of the project
- Project definition
- includes identifying the current role of spatial information in the organization, the potential for GIS, determining needs and products, writing the proposal
- System evaluation
- includes reviewing hardware and software options, conducting benchmark tests, pilot studies and cost benefit analysis
- System implementation
- includes completion of a strategic plan, system development and startup, design and creation of the database, securing on-going financial and political support
- this unit looks at the two least formal and unstructured initial stages: needs awareness and building management support
- Problem Recognition/Technological Awareness
- in order for an organization to become interested in acquiring a GIS, someone or some group within the organization: 1. must perceive that the methods by which they are currently storing, retrieving and using information are creating problems 2. must be aware of the capabilities of GIS technology
Problem Recognition
- Aronoff (1989) suggests six problems that prompt GIS interest
- spatial information is out of date or of poor quality
- g. often land information documents (maps and lists) are seriously outdated and questions regarding the current situation cannot be answered without digging through a stack of “updates” since the last major revisions
- spatial data is not stored in standard formats
- g. a city’s parcel maps will often vary in quality from one area to another
- one area may have been –flown” and mapped using aerial photography at 1:1000 scale some years ago, but updated by hand drafting
- other areas may have been mapped by photographically enlarging 1:24,000 topographic maps, or city street maps of unknown quality, and hand drafting parcel boundaries
- maps may have been reproduced by methods which introduce significant errors, e.g. photocopy
- several departments collect and manage similar spatial data
- this may result in different forms of representation, redundancies and related inefficiencies in the collection and management of the data
- data is not shared due to confidentiality and legal concerns
- analysis and output capabilities are inadequate
- new demands are made on the organization that cannot be met within the data and technological systems currently available.
Suppy–push factors
- changes in technological infrastructure
- improvements in technological capability
- in GIS: improved hardware, software, peripherals; better access to existing digital datasets, e.g. TIGER files
- declining price-performance ratios
- in GIS: impact of introduction of 286- and 386-based PCs, workstations, reduction in cost of mainframes and minis
- improved packaging of technical components to perform useful tasks
- in GIS: better (more friendly, more versatile) user interfaces, better applications software
- concerted marketing efforts of suppliers
- advertising creates an aura of necessity
- in GIS: hard not to go with the current trend, in spite of the fact that GIS advertising is probably low-key relative to other areas of EDP
- direct contact of salespeople with potential buyers
- in GIS: demonstrations at trade shows, presentations at conferences by vendors
- long-term strategies of technology suppliers
- selective phase-outs – vendor drops support of existing system to encourage new investment
- price reductions or outright donations to universities to raise students’ familiarity with product
- low-cost or cost-free pilot studies offered by vendors at potential customer’s. site
- interchange – at present, there are high costs to conversion from one GIS vendor’s system to another’s – customers are “locked in”
Demand–pull Factors
- endemic demand for accomplishing routine tasks
- need for faster and more accurate data handling in report generation, queries, map production, analysis
- society’s appetite for information is unlimited
- in GIS, there is no upper limit to need for spatial data for decision-making
- there is no totally satisfactory minimum level of accuracy for data
- more accurate data always means better decisions
- demand
- “keeping current” with technology
- maintaining systems on which the organization has become dependent
- affective demand
- perceived need among organizational actors to exploit the political, entertainment and other potentials of the technology
- in GIS: GIS technology is impressive in itself – high quality, color map output, 3D displays, scene generation – GIS output may be perceived to have greater credibility than hand-drawn products
Collecting Information on GIS
- once the need for GIS is recognized, an individual or group may begin gathering information on GIS in order to develop a management proposal
- information will need to be collected on:
- the status of existing GIS projects
- the direction the GIS industry is moving
- the potential applications of GIS in the organization
- sources of information include:
- personnel within the company
- “missionaries” or GIS proponents may have familiarity through educational background, external contacts
- industry consultants, system vendors, conversion service companies will be very willing to provide information
- industry organizations such as AM/FM International or American Congress on Surveying and Mapping (ACSM) are excellent sources a growing number of newsletters and magazines are being marketed within the GIS industry
- a useful mechanism is a Request for Information (RFI)
- sent by the company to all known vendors of GIS software
- should ask for:
- general company information
- system capabilities
- hardware and software requirements
- customer references
- general functional capabilities
- example applications
- customer support – training and maintenance programs
- general pricing information
- site visits to operating GIS projects are useful
- can observe the daily operations of the project gain insight from project personnel abbut system performance and support
Information Gathering Techniques
The main aim of fact finding techniques is to determine the information requirements of an organization used by analysts to prepare a precise SRS understood by user.
Ideal SRS Document should −
- be complete, Unambiguous, and Jargon-free.
- specify operational, tactical, and strategic information requirements.
- solve possible disputes between users and analyst.
- use graphical aids which simplify understanding and design.
There are various information gathering techniques −
Interviewing
Systems analyst collects information from individuals or groups by interviewing. The analyst can be formal, legalistic, play politics, or be informal; as the success of an interview depends on the skill of analyst as interviewer.
It can be done in two ways −
Unstructured Interview − The system analyst conducts question-answer session to acquire basic information of the system.
Structured Interview − It has standard questions which user need to respond in either close (objective) or open (descriptive) format.
Advantages of Interviewing
This method is frequently the best source of gathering qualitative information.
It is useful for them, who do not communicate effectively in writing or who may not have the time to complete questionnaire.
Information can easily be validated and cross checked immediately.
It can handle the complex subjects.
It is easy to discover key problem by seeking opinions.
It bridges the gaps in the areas of misunderstandings and minimizes future problems.
Questionnaires
This method is used by analyst to gather information about various issues of system from large number of persons.
There are two types of questionnaires −
Open-ended Questionnaires − It consists of questions that can be easily and correctly interpreted. They can explore a problem and lead to a specific direction of answer.
Closed-ended Questionnaires − It consists of questions that are used when the systems analyst effectively lists all possible responses, which are mutually exclusive.
Advantages of questionnaires
It is very effective in surveying interests, attitudes, feelings, and beliefs of users which are not co-located.
It is useful in situation to know what proportion of a given group approves or disapproves of a particular feature of the proposed system.
It is useful to determine the overall opinion before giving any specific direction to the system project.
It is more reliable and provides high confidentiality of honest responses.
It is appropriate for electing factual information and for statistical data collection which can be emailed and sent by post.
Review of Records, Procedures, and Forms
Review of existing records, procedures, and forms helps to seek insight into a system which describes the current system capabilities, its operations, or activities.
Advantages
It helps user to gain some knowledge about the organization or operations by themselves before they impose upon others.
It helps in documenting current operations within short span of time as the procedure manuals and forms describe the format and functions of present system.
It can provide a clear understanding about the transactions that are handled in the organization, identifying input for processing, and evaluating performance.
It can help an analyst to understand the system in terms of the operations that must be supported.
It describes the problem, its affected parts, and the proposed solution.
Observation
This is a method of gathering information by noticing and observing the people, events, and objects. The analyst visits the organization to observe the working of current system and understands the requirements of the system.
Advantages
It is a direct method for gleaning information.
It is useful in situation where authenticity of data collected is in question or when complexity of certain aspects of system prevents clear explanation by end-users.
It produces more accurate and reliable data.
It produces all the aspect of documentation that are incomplete and outdated.
Joint Application Development (JAD)
It is a new technique developed by IBM which brings owners, users, analysts, designers, and builders to define and design the system using organized and intensive workshops. JAD trained analyst act as facilitator for workshop who has some specialized skills.
Advantages of JAD
It saves time and cost by replacing months of traditional interviews and follow-up meetings.
It is useful in organizational culture which supports joint problem solving.
Fosters formal relationships among multiple levels of employees.
It can lead to development of design creatively.
It Allows rapid development and improves ownership of information system.
Secondary Research or Background Reading
This method is widely used for information gathering by accessing the gleaned information. It includes any previously gathered information used by the marketer from any internal or external source.
Advantages
It is more openly accessed with the availability of internet.
It provides valuable information with low cost and time.
It act as forerunner to primary research and aligns the focus of primary research.
It is used by the researcher to conclude if the research is worth it as it is available with procedures used and issues in collecting them.
Feasibility Study
Feasibility Study can be considered as preliminary investigation that helps the management to take decision about whether study of system should be feasible for development or not.
It identifies the possibility of improving an existing system, developing a new system, and produce refined estimates for further development of system.
It is used to obtain the outline of the problem and decide whether feasible or appropriate solution exists or not.
The main objective of a feasibility study is to acquire problem scope instead of solving the problem.
The output of a feasibility study is a formal system proposal act as decision document which includes the complete nature and scope of the proposed system.
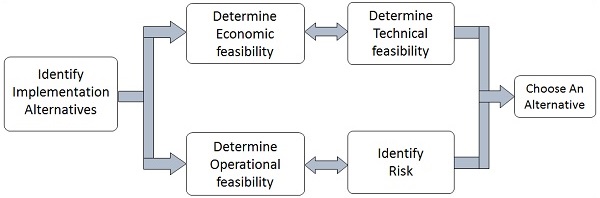
Steps Involved in Feasibility Analysis
The following steps are to be followed while performing feasibility analysis −
Form a project team and appoint a project leader.
Develop system flowcharts.
Identify the deficiencies of current system and set goals.
Enumerate the alternative solution or potential candidate system to meet goals.
Determine the feasibility of each alternative such as technical feasibility, operational feasibility, etc.
Weight the performance and cost effectiveness of each candidate system.
Rank the other alternatives and select the best candidate system.
Prepare a system proposal of final project directive to management for approval.
Types of Feasibilities
Economic Feasibility
It is evaluating the effectiveness of candidate system by using cost/benefit analysis method.
It demonstrates the net benefit from the candidate system in terms of benefits and costs to the organization.
The main aim of Economic Feasibility Analysis (EFS) is to estimate the economic requirements of candidate system before investments funds are committed to proposal.
It prefers the alternative which will maximize the net worth of organization by earliest and highest return of funds along with lowest level of risk involved in developing the candidate system.
Technical Feasibility
It investigates the technical feasibility of each implementation alternative.
It analyzes and determines whether the solution can be supported by existing technology or not.
The analyst determines whether current technical resources be upgraded or added it that fulfill the new requirements.
It ensures that the candidate system provides appropriate responses to what extent it can support the technical enhancement.
Operational Feasibility
It determines whether the system is operating effectively once it is developed and implemented.
It ensures that the management should support the proposed system and its working feasible in the current organizational environment.
It analyzes whether the users will be affected and they accept the modified or new business methods that affect the possible system benefits.
It also ensures that the computer resources and network architecture of candidate system are workable.
Behavioral Feasibility
It evaluates and estimates the user attitude or behavior towards the development of new system.
It helps in determining if the system requires special effort to educate, retrain, transfer, and changes in employee’s job status on new ways of conducting business.
Schedule Feasibility
It ensures that the project should be completed within given time constraint or schedule.
It also verifies and validates whether the deadlines of project are reasonable or not.
Analysts use various tools to understand and describe the information system. One of the ways is using structured analysis.
What is Structured Analysis?
Structured Analysis is a development method that allows the analyst to understand the system and its activities in a logical way.
It is a systematic approach, which uses graphical tools that analyze and refine the objectives of an existing system and develop a new system specification which can be easily understandable by user.
It has following attributes −
It is graphic which specifies the presentation of application.
It divides the processes so that it gives a clear picture of system flow.
It is logical rather than physical i.e., the elements of system do not depend on vendor or hardware.
It is an approach that works from high-level overviews to lower-level details.
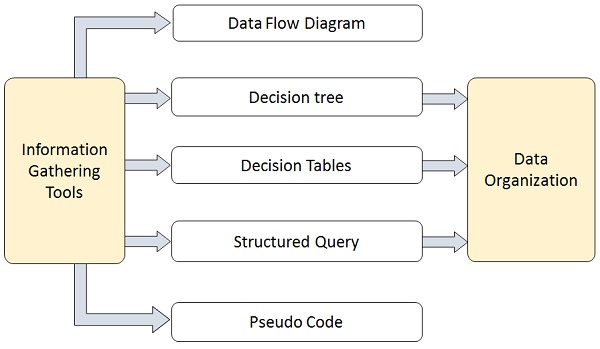
Structured Analysis Tools
During Structured Analysis, various tools and techniques are used for system development. They are −
- Data Flow Diagrams
- Data Dictionary
- Decision Trees
- Decision Tables
- Structured English
- Pseudocode
Data Flow Diagrams (DFD) or Bubble Chart
It is a technique developed by Larry Constantine to express the requirements of system in a graphical form.
It shows the flow of data between various functions of system and specifies how the current system is implemented.
It is an initial stage of design phase that functionally divides the requirement specifications down to the lowest level of detail.
Its graphical nature makes it a good communication tool between user and analyst or analyst and system designer.
It gives an overview of what data a system processes, what transformations are performed, what data are stored, what results are produced and where they flow.
Basic Elements of DFD
DFD is easy to understand and quite effective when the required design is not clear and the user wants a notational language for communication. However, it requires a large number of iterations for obtaining the most accurate and complete solution.
The following table shows the symbols used in designing a DFD and their significance −
| Symbol Name | Symbol | Meaning |
|---|---|---|
| Square |  | Source or Destination of Data |
| Arrow | Data flow | |
| Circle |  | Process transforming data flow |
| Open Rectangle |  | Data Store |
Types of DFD
DFDs are of two types: Physical DFD and Logical DFD. The following table lists the points that differentiate a physical DFD from a logical DFD.
| Physical DFD | Logical DFD |
|---|---|
| It is implementation dependent. It shows which functions are performed. | It is implementation independent. It focuses only on the flow of data between processes. |
| It provides low level details of hardware, software, files, and people. | It explains events of systems and data required by each event. |
| It depicts how the current system operates and how a system will be implemented. | It shows how business operates; not how the system can be implemented. |
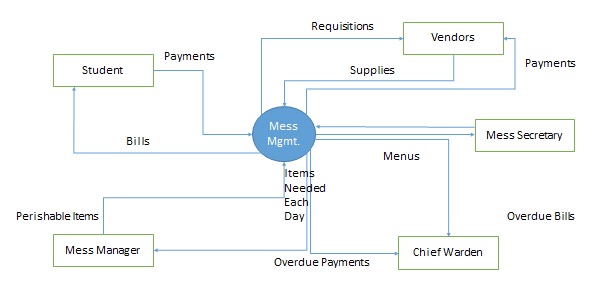
Context Diagram
A context diagram helps in understanding the entire system by one DFD which gives the overview of a system. It starts with mentioning major processes with little details and then goes onto giving more details of the processes with the top-down approach.
The context diagram of mess management is shown below.
Data Dictionary
A data dictionary is a structured repository of data elements in the system. It stores the descriptions of all DFD data elements that is, details and definitions of data flows, data stores, data stored in data stores, and the processes.
A data dictionary improves the communication between the analyst and the user. It plays an important role in building a database. Most DBMSs have a data dictionary as a standard feature. For example, refer the following table −
| Sr.No. | Data Name | Description | No. of Characters |
|---|---|---|---|
| 1 | ISBN | ISBN Number | 10 |
| 2 | TITLE | title | 60 |
| 3 | SUB | Book Subjects | 80 |
| 4 | ANAME | Author Name | 15 |
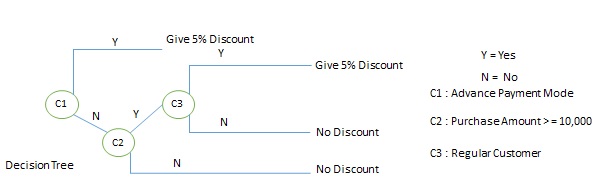
Decision Trees
Decision trees are a method for defining complex relationships by describing decisions and avoiding the problems in communication. A decision tree is a diagram that shows alternative actions and conditions within horizontal tree framework. Thus, it depicts which conditions to consider first, second, and so on.
Decision trees depict the relationship of each condition and their permissible actions. A square node indicates an action and a circle indicates a condition. It forces analysts to consider the sequence of decisions and identifies the actual decision that must be made.
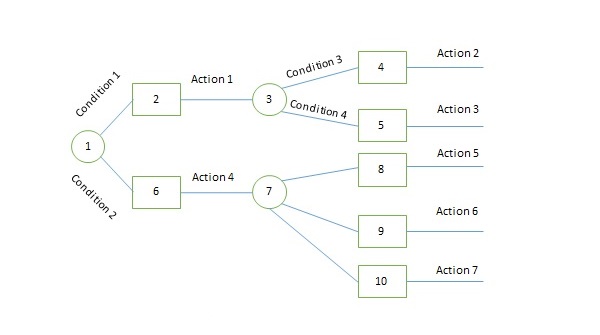
The major limitation of a decision tree is that it lacks information in its format to describe what other combinations of conditions you can take for testing. It is a single representation of the relationships between conditions and actions.
For example, refer the following decision tree −
Decision Tables
Decision tables are a method of describing the complex logical relationship in a precise manner which is easily understandable.
It is useful in situations where the resulting actions depend on the occurrence of one or several combinations of independent conditions.
It is a matrix containing row or columns for defining a problem and the actions.
Components of a Decision Table
Condition Stub − It is in the upper left quadrant which lists all the condition to be checked.
Action Stub − It is in the lower left quadrant which outlines all the action to be carried out to meet such condition.
Condition Entry − It is in upper right quadrant which provides answers to questions asked in condition stub quadrant.
Action Entry − It is in lower right quadrant which indicates the appropriate action resulting from the answers to the conditions in the condition entry quadrant.
The entries in decision table are given by Decision Rules which define the relationships between combinations of conditions and courses of action. In rules section,
- Y shows the existence of a condition.
- N represents the condition, which is not satisfied.
- A blank - against action states it is to be ignored.
- X (or a check mark will do) against action states it is to be carried out.
For example, refer the following table −
| CONDITIONS | Rule 1 | Rule 2 | Rule 3 | Rule 4 |
|---|---|---|---|---|
| Advance payment made | Y | N | N | N |
| Purchase amount = Rs 10,000/- | - | Y | Y | N |
| Regular Customer | - | Y | N | - |
| ACTIONS | ||||
| Give 5% discount | X | X | - | - |
| Give no discount | - | - | X | X |
Structured English
Structure English is derived from structured programming language which gives more understandable and precise description of process. It is based on procedural logic that uses construction and imperative sentences designed to perform operation for action.
It is best used when sequences and loops in a program must be considered and the problem needs sequences of actions with decisions.
It does not have strict syntax rule. It expresses all logic in terms of sequential decision structures and iterations.
For example, see the following sequence of actions −
if customer pays advance
   then
      Give 5% Discount
   else
      if purchase amount >=10,000
         then
            if  the customer is a regular customer
               then Give 5% Discount
            else  No Discount
         end if
      else No Discount
   end if
end if
Pseudocode
A pseudocode does not conform to any programming language and expresses logic in plain English.
It may specify the physical programming logic without actual coding during and after the physical design.
It is used in conjunction with structured programming.
It replaces the flowcharts of a program.
Guidelines for Selecting Appropriate Tools
Use the following guidelines for selecting the most appropriate tool that would suit your requirements −
Use DFD at high or low level analysis for providing good system documentations.
Use data dictionary to simplify the structure for meeting the data requirement of the system.
Use structured English if there are many loops and actions are complex.
Use decision tables when there are a large number of conditions to check and logic is complex.
Use decision trees when sequencing of conditions is important and if there are few conditions to be tested.
Comments
Post a Comment